
Meet the “Google Earth of Biology,” the OneZoom Explorer, recently launched by the Imperial College of London. This interactive, online experience maps the connections between 2.2 million living species in a visual, searchable format, including over 85,000 images. Yes, the Tree of Life is now online, fulfilling a quest of over two centuries, allowing you to follow life’s path to humanity eons later.
In 1801, the French teacher and Catholic priest, Augustin Augier, published the first “Tree of Life,” a diagram purporting to show the relationships between species in a visual format using the trunk and branches of a tree as a metaphor. Noble and other wealthy families had been using tree diagrams to map their often complicated relationships since the medieval era, but this was the first time the concept had been applied to all life. Augier was a Catholic priest working 60 years prior to the publication of Charles Darwin’s On the Origin of the Species, and his “Abre botanique” wasn’t truly based in biology and didn’t acknowledge that species have changed over time. Indeed, any change over time wasn’t acknowledged at all. The goal was to capture the perfect order of nature as created by God himself, a static model of the glory of creation that would stand for all time.
A few years later, the naturalist and pioneer in evolutionary theory, Jean Baptiste-Lamarck included his own version of the tree of life in his Philosophie zoologique published in 1809. He referred to his diagram as a table, “tableau” in French and though he believed animals evolved over time, he failed to recognize that all life on Earth descends from a single organism, the original replicator buried in the ancient past, some 3.5 billion years ago or more. Instead, Lamarck’s tree depicted parallel lineages; evolution within each line, but not across what he considered the main categories of life. This is not the only time Lamarck came close to genius without grasping the full implications of his own ideas. He infamously believed in the “inheritance of acquired characteristics,” meaning a giraffe has a long neck because it stretches toward the trees and that act of stretching is passed down from generation to generation, rather than purely inherited characteristics as we know today.
Fast forward to 1840 and the American geologist, Edward Hitchock published a chart using the tree structure in his Elementary Geology. He placed the geological periods known at the time across the vertical axis, suggesting that life has changed over the eras, but he too had separate trees for plants and animals, and multiple trunks within each category. Mr. Hitchcock did, however, grasp the branching aspect of change over time, depicting various species using real names diverging from a single source. At the same time, he firmly believed an all-powerful deity was responsible for the process rather than evolution. In 1844, the first edition of Robert Chambers Vestiges of the Natural History of Creation was published in England, anonymously at the time. The book used a tree diagram to illustrate the “Hypothesis of the development of the vegetable and animal kingdoms,” noted there “maybe branching,” but once again the diagram fell short of being an explicit representation of the history of life.
It would be the legendary naturalist Charles Darwin that brought all of these disparate threads together in his seminal, ground breaking On the Origin of Species. It’s worth quoting him at length on the topic, “The affinities of all the beings of the same class have sometimes been represented by a great tree. I believe this simile largely speaks the truth. The green and budding twigs may represent existing species; and those produced during each former year may represent the long succession of extinct species. At each period of growth all the growing twigs have tried to branch out on all sides, and to overtop and kill the surrounding twigs and branches, in the same manner as species and groups of species have tried to overmaster other species in the great battle for life. The limbs divided into great branches, and these into lesser and lesser branches, were themselves once, when the tree was small, budding twigs; and this connexion of the former and present buds by ramifying branches may well represent the classification of all extinct and living species in groups subordinate to groups. Of the many twigs which flourished when the tree was a mere bush, only two or three, now grown into great branches, yet survive and bear all the other branches; so with the species which lived during long-past geological periods, very few now have living and modified descendants. From the first growth of the tree, many a limb and branch has decayed and dropped off; and these lost branches of various sizes may represent those whole orders, families, and genera which have now no living representatives, and which are known to us only from having been found in a fossil state.”
Typically, Darwin saw the full scope and implications of the concept and outlines them in one simple, easy to understand paragraph that continues to resonate more than a century and half later. The evolutionary biologist, Stephen Jay Gould, famous for his punctuated equilibrium approach to evolutionary theory, believes this passage was at a “crucial spot in his text,” concluding the concept of natural selection and opening the door to a broad application of its usage to understand the interconnectedness of all life. At the same time, Darwin himself was missing a crucial piece of the evolutionary puzzle. He correctly hypothesized that evolution was driven by the natural selection of hereditary traits, but he had no mechanism for which these traits were passed down from parents to their offspring. Thus, he and other biologists of the day were limited to examining the physical aspects of animals, known as their phenotype today, and comparing them to others to understand the relationships.
If animals closely shared characteristics or behaviors, they’d be grouped into the same genus, family, order, class, phylum, kingdom, and ultimately domain. Phenotypes, however, are only a superficial measure because evolutionary processes often develop very similar traits through different means, a concept known as convergent evolution. The eye for example has arisen at least 7 times over the eons. The wing has also developed independently in insects, birds, mammals, even fish. In other words, organisms simply sharing some of the same traits, or even looking very much alike, will only get you so far in understanding the details of their evolutionary history and how close they are on the Tree of Life. Instead, you need to understand what’s going on beneath the surface, knowing how these traits are passed down and then mapping the unique units of heredity between different species. The great Augustinian friar, Gregor Johann Mendel, would point the way forward in this regard, conducting his famous experiments on pea plants around the same time Darwin published On the Origin of Species. Part meteorologist, mathematician, biologist, and abbot, he surmised that invisible “factors” were passed down from generation to generation, following certain, binary dominant and recessive rules, but alas the true genius of his work wasn’t recognized until the early 1900s.
In 1918, Sir Ronald Aylmer Fisher, a British renaissance man with an interest in mathematics, statistics, and biology would finally combine the work of Darwin and Mendel into what would come to be known as the “modern synthesis.” Sir Fisher has been described as “a genius who almost single-handedly created the foundations for modern statistical science” and “the single most important figure in 20th century statistics,” but even then the modern synthesis would not fully take hold of the scientific imagination for another 20 years. It wasn’t until the 1940s that the stage was fully set to finally identify and begin mapping out the elusive unit of heredity with the discovery of Deoxyribonucleic acid, DNA, and its identification as the molecular repository for Mendel’s “factors.” These had become known as “genes,” a term coined by the Dutch botanist, plant physiologist, and geneticist Wilhem Johannsen in 1909. Building on the work of Rosalind Franklin and Maurice Wilkins, James D. Watson and Francis Crick published the breakthrough “double helix” model of DNA and discovered the method of genetic replication in 1953. For the first time in history, humanity could finally peer into the inner workings of heredity, fully understanding how traits are stored within our cells, how they are replicated, and how they are passed down.
Alas, it still wasn’t enough to create a complete and accurate Tree of Life. The knowledge of how DNA and genes work was one thing. The application of that knowledge would wait about another 50 years until gene sequencing technology and computers powerful enough to manipulate and compare the data came of age. In 1990, scientists around the world began work on The Human Genome Project, an ambitious attempt to create a complete map of human DNA, determining every base pair and the sequences of all our genes. The effort to unravel some three billion nucleotides was carried out across twenty different universities and research centers in the United States, the United Kingdom, Japan, France, Germany, India and China. The group would spend some $2.7 billion, largely funded by the United States government through the National Institutes of Health and the Department of Energy of all places, and take 13 years, but ultimately achieve success in 2003, two years earlier than planned and slightly under a projected cost of $3 billion. It was an incredible achievement at the time, a milestone in biology and genetics, yet like anything else driven by technology, advances continued, far faster than anyone expected.
Today, what once took thirteen years and required the combined efforts of twenty institutions can be done in barely thirty minutes and instantly uploaded to the cloud. The technology is so readily available and affordable that anyone can order their own DNA test online for the cost of about $100. This explosion has enabled scientists around the world to begin sequencing the genomes of almost every creature on earth, comparing them together to far more accurately understand the relationships between different species. The physical form an animal takes can be deceiving, but the genes don’t lie and the percentage shared between different species allows us to finally create a true Tree of Life, upending many of our earlier assumptions. For example, a study of the relationship between different species of birds found that falcons are more closely related to parrots than hawks or eagles. Flamingoes have only one living “cousin,” the duck-like grebe with a radically different appearance, and both are closer to a common pigeon than any other water bird. Humans were found to be closer to gorillas than we’d previously believed. Rather than gorillas closest to chimps and chimps closest to humans, it’s humans much closer to both, and perhaps even closer to orangutans than other great apes. “This doesn’t change the overall view of evolution, and the overall tree is still the same. What this does show is that each branch has it own complexities and challenges,” explained Richard Gibbs, a geneticist at Baylor College of Medicine’s Human Genome Sequencing Center. “It means within each branch things can happen. We can’t just conform to a simple tree on a gene-by-gene basis.”
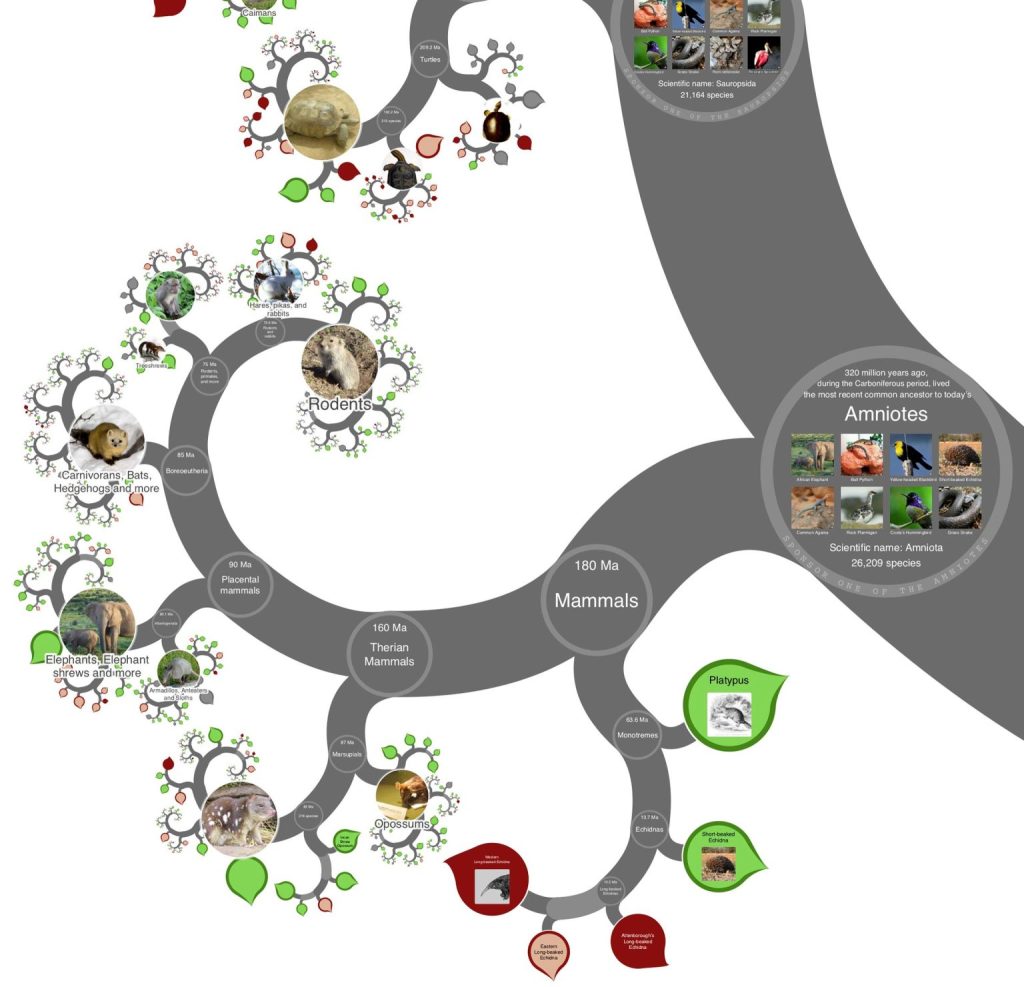
There are countless other examples, and now, for the first time ever, anyone can explore these relationships for themselves from the comfort of their own home: Meet the “Google Earth of Biology,” the OneZoom Explorer (https://www.onezoom.org/), recently launched by the Imperial College of London. This interactive, online experience maps the connections between 2.2 million living species in a visual, searchable format, including over 85,000 images. Developed by Imperial College of London biodiversity researcher Dr. James Rosindell and University of Oxford evolutionary biologist Dr. Yan Wong, this remarkable collection is open to the public and free to access. Dr. Wong explains, “By developing new algorithms for visualization and data processing, and combining them with ‘big data’ gathered from multiple sources, we’ve created something beautiful. It allows people to find their favorite living things, be they golden moles or giant sequoias, and see how evolutionary history connects them together to create a giant tree of all life on Earth.” Dr. Rosindell added, “Two million species can feel like a number too big to visualize, and no museum or zoo can hold all of them! But our tool can help represent all Earth’s species and allow visitors to connect with their plight. We hope that now this project is complete and available, many venues will be interested in using it to complement their existing displays.”
The One Zoom explorer starts at a single trunk representing all life, before branching out in two, representing eubacteria and the more complicated archaea and eukaryotes that would go one to form the foundation of both the plant and animal kingdoms. From the very beginning, one is struck by the sheer size and scope of the tree. Life on earth is a massive, complicated, roiling mass, filled mostly with obscure species, unfamiliar to most people branching off in almost countless ways. Three billion years ago, the archaea and eukaryotes split. Following the eukaryotic line far, far down that branch eventually leads to bilaterally symmetric animals some 570 million years ago during the Cambrian Explosion, the distant ancestors of humanity itself, but the path along the way is far from straight.
In fact, bilaterally symmetric animals like ourselves and other common animals aren’t exactly easy to find unless you zoom in closely. They occupy such a small area, barely a twig, and aren’t visible at all when you look at the whole diagram at once. Before you arrive at anything resembling our ancestors or even so much as an insect, you pass through several different offshoots of single celled organisms known as archaea, and the split between animals and plants some 2.15 billion years ago, accompanied by many interesting microscopic organisms you probably aren’t familiar with except in only the most passing fashion. For instance, the “Podiata,” which includes the modern amoeba, the Amerophea (1.95 billion years ago), the Obozao (1.8 billion), the Apusomonads (1.7 billion), and then finally the more commonly known animals and fungi (1.35 billion). Even after traveling so far, you remain distant from “normal” animals, lions, tigers, bears, and us. There is the Filasteria, another offshoot of the amoeba, this time a multicellular variety that radiates protrusions known as filopodia, used to latch onto surfaces and hunt prey. The Choanoflagellates, another early multicellular group seen as a precursor to modern animals. These organisms have a single flagellum that leads into a sort of collar. The flagellum whips around like a tail, drawing water in through the collar and into the main ovoid chamber. They can reproduce both sexually and a sexually.
It is only at 650 millions years ago that we begin to approach the origins of modern species, when the tree splits into sponges, then placozoa, comb jellies, corals and sea anemones, and finally bilaterally symmetric animals. Buried way down that branch after you pass flatworms and nephrozoa you reach chordates at last, animals with spinal cords. From there, you have to look even deeper to find humanity itself, making the One Zoom explorer a fascinating if humbling experience. The Tree of LIfe is massive, millions of interconnected species, and we are just one tiny, almost invisible branch in the grand scheme of things. Go see for yourself at www.onezoom.org.
